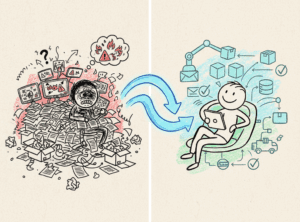
Let’s be honest – E-Commerce analytics can feel like drowning in a sea of numbers. Every platform you use throws dozens of metrics at you, and suddenly you’re tracking everything from bounce rates to session duration to cart recovery emails. Before you know it, you’re spending more time analyzing data than actually improving your business.
I’ve seen too many e-commerce owners get paralyzed by analytics overload. They’re tracking 30 different metrics daily, creating beautiful dashboards, and feeling like they’re being “data-driven”- but their conversion rates aren’t budging.
Here’s what I’ve learned after years of working with e-commerce businesses – most metrics are just noise. There are only a handful that truly matter for your day-to-day operations, and focusing on these will give you more clarity and better results than tracking everything under the sun.
Today, I’m going to break down the analytics that actually move the needle – and more importantly, show you how to use them to make real improvements to your business.
The Big Five – Your E-Commerce Funnel Markers
Think of your e-commerce business as a funnel with five critical checkpoints. Every visitor who comes to your site needs to pass through these stages to become a customer:
- Traffic – People landing on your website
- Product Views – Visitors actually looking at your products
- Add to Cart – Customers showing purchase intent
- Begin Checkout – Serious buyers starting the purchase process
- Transactions – Completed purchases
These five metrics are your funnel markers, and they’re the only ones you need to monitor religiously. Everything else? That’s what I call “troubleshooting metrics”: useful when something goes wrong, but not worth daily attention.
The magic happens in the conversion percentages between each stage. Your job isn’t to obsess over absolute numbers – it’s to constantly improve how many people move from one stage to the next.
Let’s say you have 1,000 visitors this month:
-
- 600 view products (60% conversion from traffic to product views)
-
- 120 add items to cart (20% conversion from product views to cart)
-
- 90 begin checkout (75% conversion from cart to checkout)
-
- 54 complete transactions (60% conversion from checkout to purchase)
Your overall conversion rate is 5.4% (54 transactions ÷ 1,000 visitors), but the real insights are in those stage-to-stage percentages. Maybe your traffic-to-product-view rate is fantastic at 60%, but your cart-to-checkout rate is lagging at 75%. That tells you exactly where to focus your efforts.
The Power of Percentage Monitoring
Here’s what I’ve found works best – track these five numbers weekly, and focus on improving one conversion percentage at a time.
If only 15% of your product viewers are adding items to cart, that’s your bottleneck. Don’t worry about your checkout process yet – fix the product page experience first. Maybe you need better product descriptions, more reviews, or clearer pricing.
Once you get that 15% up to 25%, then you can tackle the next weak link in your funnel.
One important caution – when you optimize a single step, make sure you aren’t hurting the next step. Otherwise the gains are just smoke and mirrors. Example: many businesses juice Product Views or Add to Cart with aggressive incentives, but if it doesn’t also lead to more Begins Checkout, your Cart-to-Checkout rate drops and overall conversion doesn’t improve.
This approach prevents you from trying to fix everything at once (which rarely works) and gives you clear, measurable goals.
When to Use Your Troubleshooting Metrics
Now, what about all those other metrics? They become incredibly valuable when one of your funnel markers starts declining: but only then.
Let’s say you notice your checkout-to-transaction conversion rate dropped from 60% to 45% last week. That’s your signal to dig deeper using troubleshooting metrics:
-
- Payment method breakdown – Are people struggling with a specific payment option?
-
- Transaction amounts – Did average order values change dramatically?
-
- Coupon usage – Are discount codes not working properly?
-
- Device type – Is mobile checkout suddenly broken?
-
- Geographic data – Are international customers having issues?
I worked with a client who saw their checkout-to-transaction rate plummet by 12% overnight. Instead of panicking and changing everything, we looked at the troubleshooting metrics.
The breakdown by payment method showed that PayPal transactions had dropped to zero. Everything else looked normal. A quick check revealed their PayPal integration had broken during a site update, but customers weren’t getting a clear error message: they were just abandoning their carts in confusion.
One quick fix to the PayPal integration, and conversion rates bounced right back.
Without focusing on the core funnel first, we might have spent weeks tweaking product pages, adjusting checkout flows, or testing new features. The troubleshooting metrics pointed us directly to the problem.
Setting Up Your Analytics the Right Way
Here’s how to implement this approach:
Daily Check (5 minutes):
-
- Look at yesterday’s numbers for all five funnel markers
-
- Calculate the conversion percentages
-
- Note any dramatic changes (more than 20% up or down)
Weekly Review (30 minutes):
-
- Compare week-over-week performance
-
- Identify your weakest conversion percentage
-
- Plan one specific improvement for the following week
Monthly Deep Dive (2 hours):
-
- Analyze trends over the past month
-
- Use troubleshooting metrics to understand any significant changes
-
- Set goals for the next month’s improvements
The key is consistency without obsession. These numbers should inform your decisions, not paralyze you.
What About All Those Other Metrics?
You’re probably wondering about bounce rate, session duration, pages per session, email open rates, and dozens of other metrics your tools are tracking.
Here’s my take – they’re all secondary.
Sure, bounce rate might correlate with your traffic-to-product-view conversion, but why track two metrics when one gives you the actionable insight? If people aren’t viewing products, it doesn’t matter if they’re bouncing in 3 seconds or 30 seconds: the result is the same.
This doesn’t mean ignore everything else forever. But until you’ve optimized your core funnel and have consistent growth, don’t get distracted by vanity metrics that don’t directly impact revenue.
Mistake #1: Tracking everything daily I’ve seen business owners check 20+ metrics every morning. This creates anxiety, not insight. Stick to your five funnel markers for daily monitoring.
Mistake #2: Changing multiple things at once When conversion rates drop, the temptation is to fix everything immediately. But if you change your product pages AND your checkout process AND your email sequences all at once, you’ll never know what actually worked.
Mistake #3: Focusing on absolute numbers instead of percentages Getting 100 sales this month versus 80 last month sounds great: until you realize your traffic doubled. Your conversion rate actually went down, which is the real story.
Mistake #4: Not giving changes time to work E-commerce improvements take time to show results. Give any change at least two weeks before deciding if it’s working, unless you see immediate red flags.
Making It Actionable: Your 30-Day Challenge
Here’s what I want you to do for the next 30 days:
Week 1: Set up tracking for your five funnel markers and establish your baseline conversion percentages.
Week 2: Identify your weakest conversion percentage and research one specific improvement you can make.
Week 3: Implement that improvement and continue monitoring your funnel.
Week 4: Measure the results and plan your next improvement for the following month.
That’s it. No complex dashboards, no dozen different tools, no daily panic over fluctuating metrics. Just focus, measure, improve, repeat.
The Bottom Line
E-commerce analytics don’t have to be overwhelming. By focusing on these five funnel markers and using everything else as troubleshooting tools, you’ll get clearer insights and better results with less stress.
Remember: the goal isn’t to track everything: it’s to improve the things that matter most. Your funnel markers tell you where to focus, and your troubleshooting metrics help you solve problems quickly when they arise.
Start simple, stay consistent, and let the data guide your decisions without letting it paralyze your progress. Your conversion rates (and your sanity) will thank you.
If you’re looking for more ways to optimize your e-commerce operations systematically, check out our approach to sustainable growth that goes beyond just fixing immediate problems.